 malloc et free sont des outils formidables, mais quand on s'est un peu embrouillé dans son code, ça devient vite une plaie. Je m'explique: le système d'allocation dynamique ne fonctionne pas "magiquement": il conserve autour des blocs libres et occupés des informations : taille de la zone, prochaine zone libre, etc. Elles sont évidemment importantes lorsqu'une zone libre est allouée ou qu'une zone occupée est libérée, mais elles servent aussi lors d'opérations de "compaction" (pensez au defrag du disque windows, vous n'êtes pas loin). Si on dépasse l'espace alloué pour une zone A, on peut facilement aller écraser les informations de contrôle d'une zone B. Du coup, on perd le lien entre la cause de l'erreur (le code qui gère A) et ses conséquences (erreur lors de la libération ou de l'allocation de B).
Dynamic memory allocation is a key aspect of programming that both open new horizons and puzzle newbie programmers. Unfortunately, it can also become a real nightmare for the seasoned programmer who has overestimated his skills, even just temporarily. malloc and free are not built from magic out of the void*, of course. They are algorithms that use small memory headers to maintain internal information about which block is free, how big is what, etc. This information is used when allocating/freeing blocks, of course, but also in the process of coercing small, contiguous free blocks into a larger one to avoid excessive memory fragmentation.
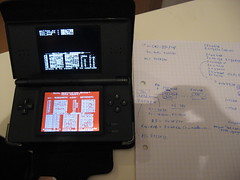
The problem is, that if code responsible for block A trashes information about block B (e.g. due to a buffer overflow bug), the error remains latent until block B is used again, and by then, you completely lost the knowledge that A is the faulty guy. Ca fait un moment que je traine un bug de ce genre dans runme, sans trop savoir si c'est mon code qui est en faute ou celui de NTXM, le module player que j'y ai intégré. Bug plus ou moins facile à reproduire d'une révision à l'autre, mais que je sais être lié à une erreur de gestion de mémoire grâce au "crash code address" indiqué sur l'écran "guru meditation". Ces dernières semaines, j'ai pas mal avancé dans la gestion des erreurs et j'ai maintenant une fonction die() qui peut reprendre la main en cas de guru meditation ou d'exception C++ non traitée. Elle peut à présent tenter de retourner au moonshell, mais aussi afficher le contenu de n'importe quelle zone de mémoire de la DS. De quoi étudier la situation de manière un peu plus méthodique.
I know that I've got such a bug in runme (hence the lack of releases and the extensive use of gedsdemo). It's reappearing now and then and then hides again for a few releases. I've already proceed to a few code sanitization steps, but it doesn't look like i've been effective. With my recent findings (__cxa_terminate) and the introduction of a die() loop that replace main() after a guru meditation has been notified, I've given myself a memory inspection tool that let me follow "valid blocks" (starting the list from entries in __malloc_av_, the entry point of free lists) up to a faulty block that precedes the one where malloc/free() triggered an exception due to a wrong size.
Now, the goal is to trace back the owner of this memory block ... to be continued.
Un papier ... un bic ... pas mal de patience et la DS branchée sur chargeur ... C'est parti.
Tuesday, December 22, 2009
Tracking Memory Bugs
![]()
Subscribe to:
Post Comments (Atom)


 Vote for your favourite post


1 comment:
tu auras bientot une application plus aboutie que ce Nintendo propose aux developpeurs non ?
Post a Comment